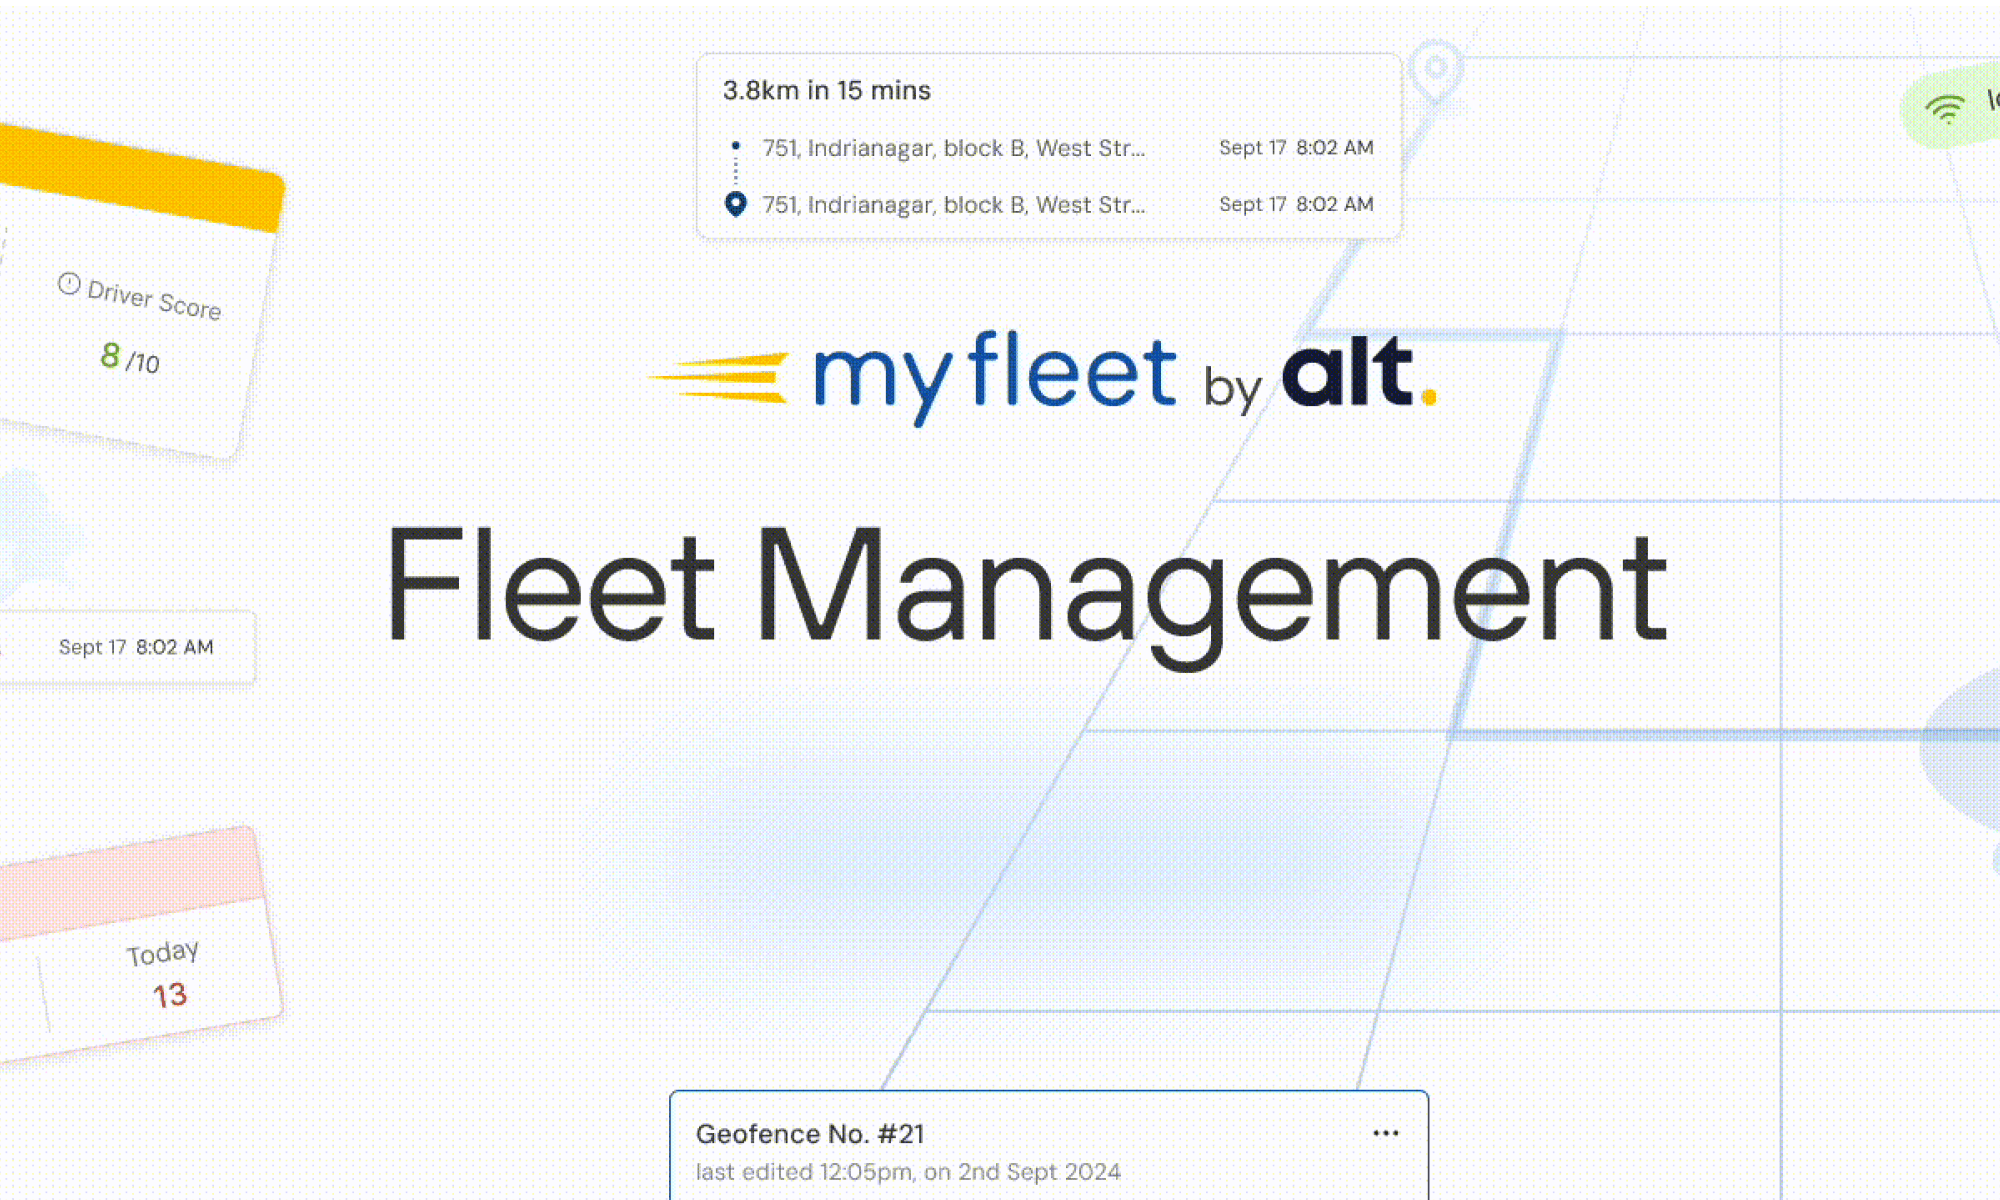
B2B SAAS Dashboard (Part I)
TL;DR
Company: Alt Mobility (EV leasing & asset management)
Product: MyFleet — a dashboard for fleet operators
Users: City managers, fleet founders, ground staff managing 200–700 EVs
Problem: Manual coordination, lack of visibility, inefficient fleet tracking
Solution: Real-time vehicle tracking, trip & stop categorization, geofencing alerts
Impact: 78% reduction in manual coordination, 75% daily active usage
What does Alt do?
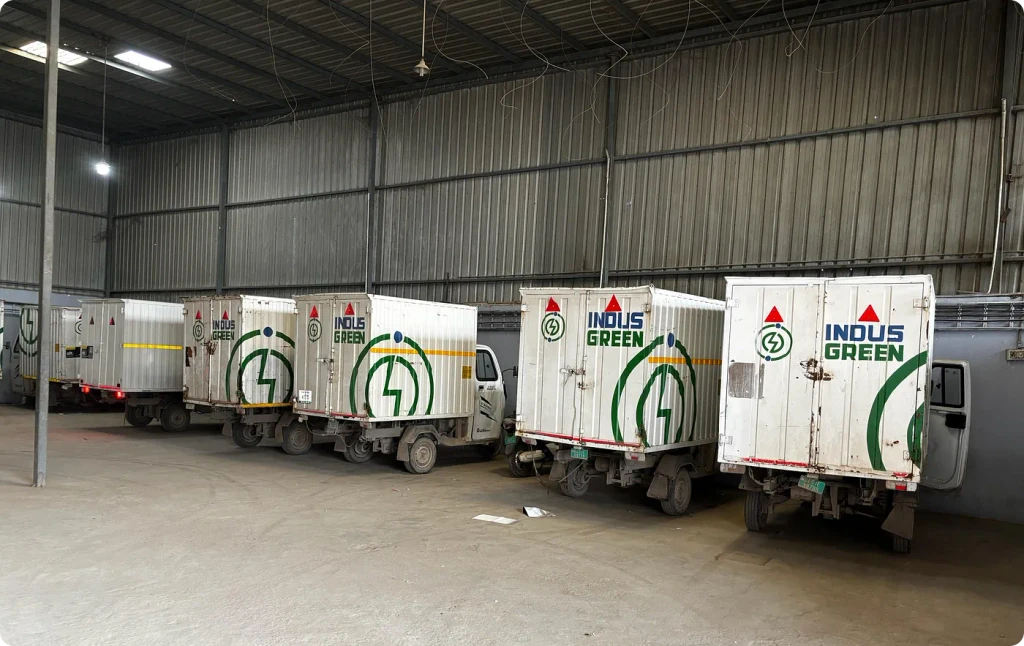
We help fleets lease commercial electric vehicles (EVs) across 20+ Indian cities. With ₹200 cr worth of vehicles to manage, real-time monitoring is non-negotiable to keep them running smoothly.
Seen Zepto, Zomato EV drivers riding flashy two-wheelers? Or that three-wheeler cargo pickup waiting outside your house with a delivery package? Remember the last time you booked a vehicle via Porter to pick up your stuff? Yes, I’m talking about those vehicles.

Problem Statement
Managing a fleet was a manual and inefficient process. Fleet operators struggled to track vehicles in real time, spot misuse, and make timely decisions.
Lack of visibility of routes: there was no way to track the routes drivers took; drivers often took detours, took up side gigs, and used the vehicle to run personal errands.The existing dashboard didn’t show clear routes.
Geofence violations & risk of vehicle theft: there was no way to ascertain if the vehicles were operating in the designated neighbourhood/ geo-zones.
Lack of customisable filters: filters were too basic to use & hidden away making it impossible to quickly find relevant vehicles, trips, zones, or violations.
And with no single source of truth, teams relied on phone calls, WhatsApp groups, and scattered google sheets to stay updated — eroding trust and slowing down daily operations.
Objective
Our goal was to help fleet operators make faster, data-driven decisions by giving them real-time visibility into their EV operations.
We set out to redesign the MyFleet dashboard to streamline manual workflows, reduce dependency on calls and WhatsApp updates.
My Role
👋🏼 Hi! I’ve been a product designer at Alt for over a year, leading my first project from discovery to delivery.
Research Findings
When we investigated low customer satisfaction with the legacy dashboard, we found that while it offered a general performance overview, it failed to surface critical alerts and real-time trip data.
Fleet operators across India—managing 200–700 EVs daily—were relying on manual calls, google sheets, and WhatsApp groups to stay updated. These methods were error-prone, and time-consuming.


Fleet operator's tool stack
To check a vehicle’s location, I call the supervisor, who then calls the driver.
—Fleet Founder, Delhi
In over 8 interviews with fleet owners, city managers, and ground teams, we uncovered recurring pain points:
Vehicles often left designated zones without alerts.
No reliable way to confirm completed trips.
Side gigs and personal detours went undetected.
No ability to set geofence & monitor breaches.
These findings pointed to a larger insight: operators needed real-time visibility and control, not just data summaries.


Alll my important vehicle updates gets buried in sea of WhatsApp messages, making it hard for me to stay updated
—City Manager, Pune
User Stories
We condensed the above problems and insights from our research into simple user stories:
As a fleet operator, I want to see live vehicle location, so that I don’t have to call drivers to track their trips.
As a fleet operator, I want to set geofences, so that I get notified when a vehicle leaves its zone.
As a fleet manager, I want to receive real-time alerts for vehicle misuse or delays so that I can intervene before it affects deliveries.
Solution (Design) — Introducing MyFleet!
Myfleet is our subscription based fleet-monitoring dashboard given exclusively to our customers or B2B operators along with their lease.

Existing Screens
FleetOS, our existing internal tool, was never intended for external users. But as customer requests grew, its limitations became increasingly visible.
It showed only the live location of vehicles, with no way to replay routes or view trip history—forcing operators to rely on phone calls to confirm deliveries.
Geofence breaches were default set for cities, offering no real-time alerts or escalation pathways.
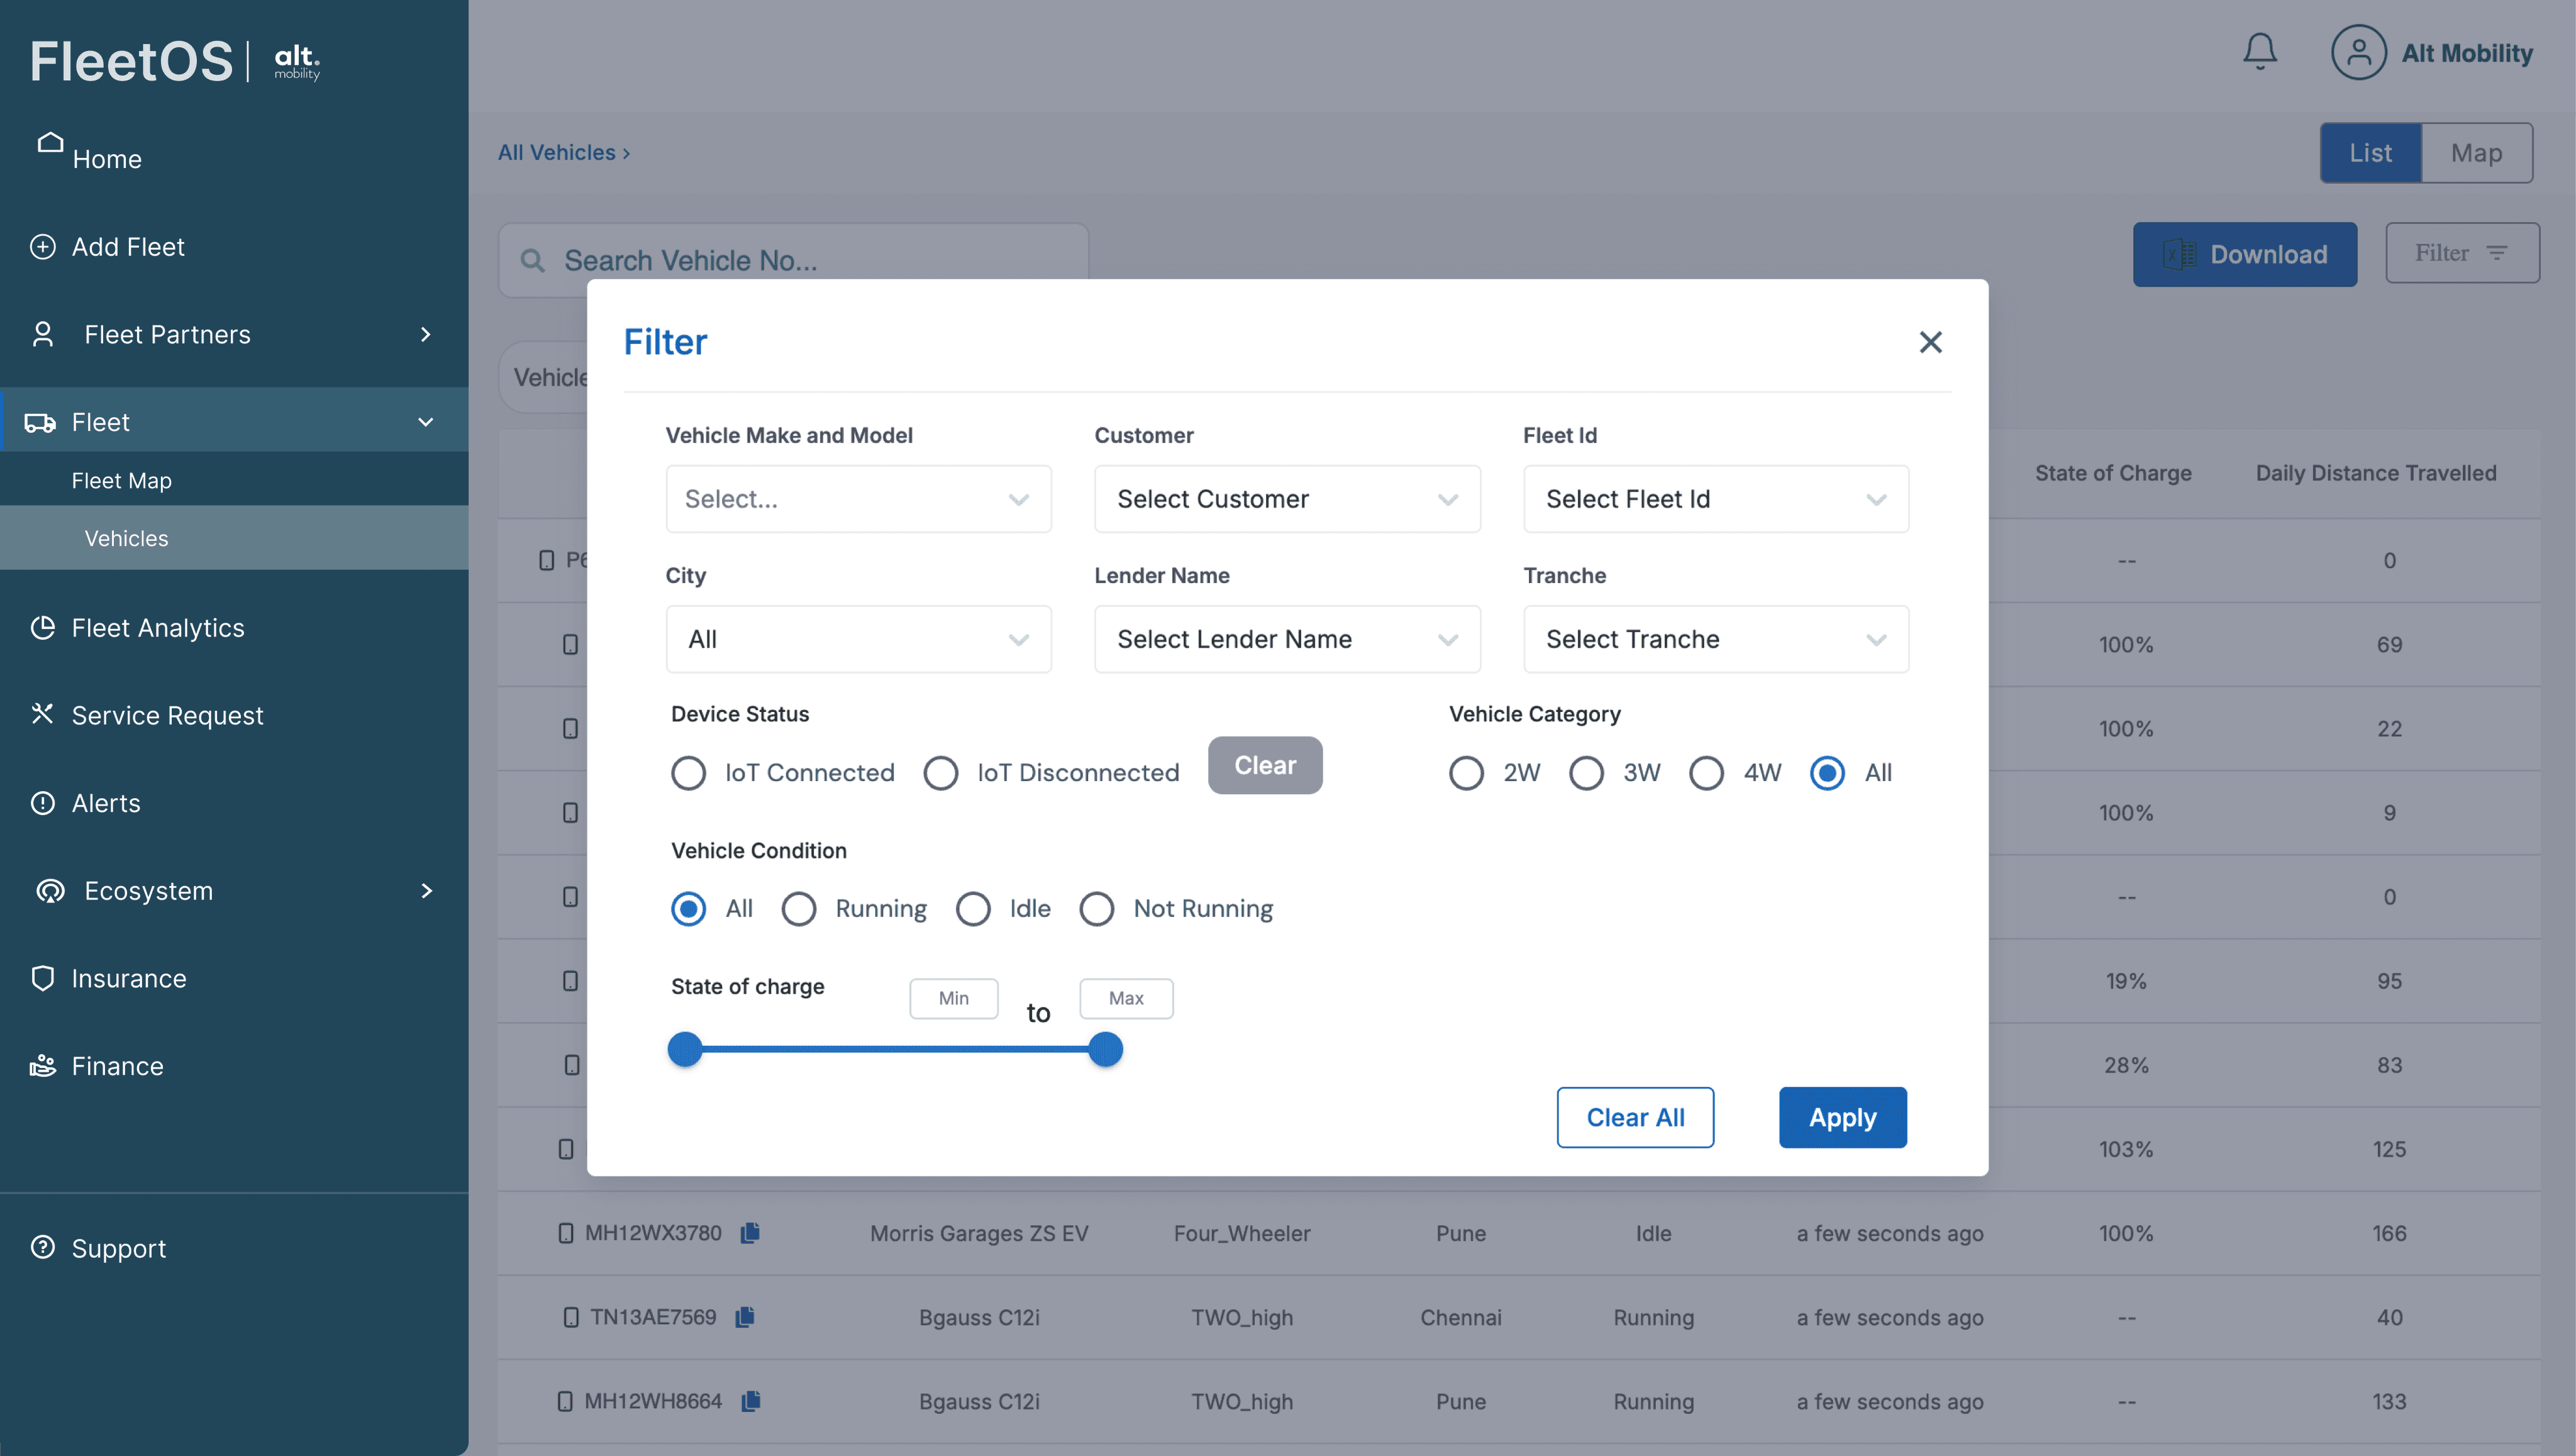
The filter panel was bloated with rarely-used fields, making it hard to quickly narrow down critical insights like city or vehicle category.
The layout lacked clear prioritization, important actions like immobilizing a vehicle or monitoring battery health were buried among less relevant data.
Designed originally for internal teams, FleetOS failed to meet the fast-paced, decision-heavy needs of real-world fleet operators—prompting us to redesign from the ground up.
Redesigned: So, we redesigned the filters, vehicle details page, and map view — and reimagined them into a new dashboard we called MyFleet.
Imagined & Defined: with through on-ground research & shadowing, we introduced new concepts like Trips, Stops, and Geofences for better visibility.
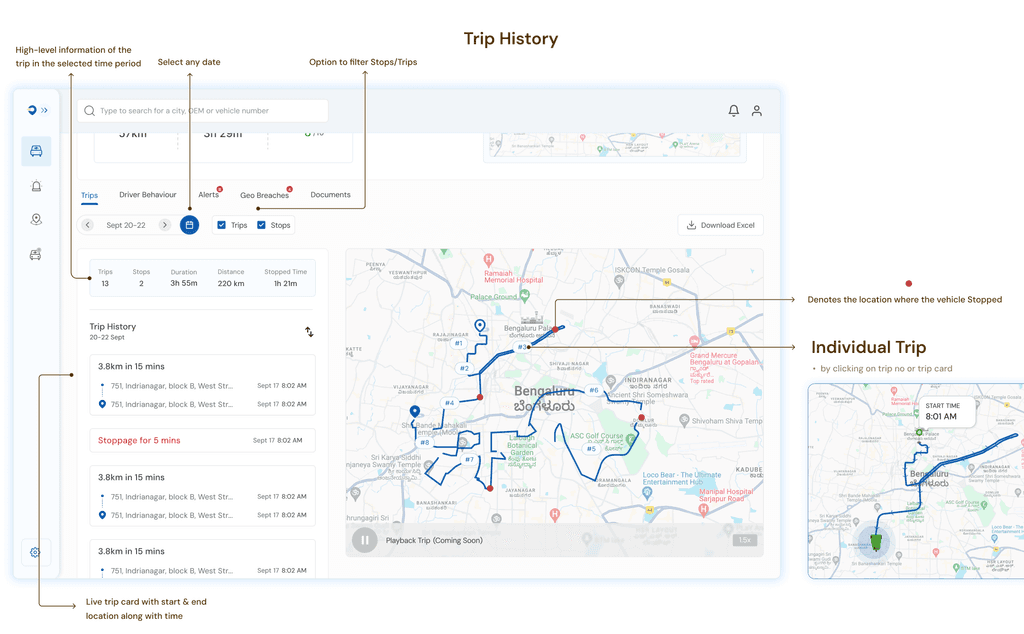
Introducing Trips & Stops
PROBLEM
#1
Lack of visibility of routes: there was no way to track the routes drivers took; drivers often took detours, took up side gigs, and used the vehicle to run personal errands.
To solve the visibility of the route drivers took, we looked beyond live location and started storing the coordinates to form a trip. We looked at various different ways we could now visually show where all the vehicle travelled.
While shadowing a hub operator, we noticed that drivers would often take detours during work hours — sometimes to run personal errands or pick up side gigs on the way.
Knowing that the fleet operator would constantly guess the time taken to complete trip, where the driver stopped for a break, the duration of the break allowed us to do the heavy lifting by categorising trips and stops!
Trips
Certain vehicles would run more than the expected delivery distance. This would happen because a lot of times the drivers go off route to do their personal work. Trips would catch these instances.
Stops
We classified static readings as “Stoppages” which could indicate:
Driver waiting at a traffic light
Loading/unloading goods
Lunch/water break


Geofencing
PROBLEM
#2
Geofence violations & risk of vehicle theft: there was no way to ascertain if the vehicles were operating in the designated neighbourhood/ geo-zones.
We designed a comprehensive detailed analytics dashboard on geofence breaches. Showing these breaches helped in bringing visibility.
The UI needed to inspire confidence by showing all the breaches made to the geofence so they could call the driver & alert him, when needed.


"One vehicle was stolen. We only realized it had left the zone an hour later because we didn’t have alerts set up."
—City Manager, Delhi-NCR
To validate our assumptions, we travelled to various hubs in Delhi to test an early prototype. To our immediate surprise, none of the participants faced friction in setting up geofences, despite our expectations otherwise. The feature resonated well with participants, confirming our intuition around designing for speed.
Over-designing Filters
PROBLEM
#3
Lack of customisable filters: filters were too basic to use & hidden away making it impossible to quickly find relevant vehicles, trips, zones, or violations.
The goal of the filters was to slice and dice the cluster of data. I assumed that more granularity and customization would reduce the operator’s uncertainty. However, after testing many iterations of this flow, we repeatedly observed that:
Operators only wanted high-level information such as city and vehicle category to see the number of vehicles in a bucket (e.g., showing 27 results).
Operators weren’t too worried about granular-level data such as the number of vehicles with battery <25% in operating in Okhla #14 geofence.
These observations made us realise that too many options overwhelmed them. After a third round of poor testing, I scrapped the idea in favour of a high-level quick filter.


Map, charging and service garage
Users can view all vehicles on a map with current locations and status indicators.
They can filter the vehicle list based on various criteria (OEM, type, city, status, mobility)
Access a summary of active alerts categorised in the cards (e.g., service due, low battery).


Impact on Business & Users
Before launching this set of update on MyFleet, fleet operators struggled to keep up with one zone in a day, manually tracking locations, coordinating with drivers, and picking endless calls. It was slow, inefficient, and frustrating. With MyFleet, our B2B customers now manage their entire fleet vehicles across zones without daily hassle.
By fixing their biggest roadblocks, we made fleet operations smoother, faster, and scalable. And as they expanded, they leased more vehicles from us, fuelling our own growth in return. Their success became ours, proving that when we solve the right problems, everyone wins.
Key Performance Indicators
78% reduction in manual coordination and tracking methods.
75% of our Fleet Operators use Myfleet on a daily basis.

Team :)
Taking sole ownership of the project was the most riveting experience of my life. I learned so much about how the EV ecosystem functions, how different teams operate, and about the on-ground reality of fleet management and its share of nail-biting stress. I’m happy we could make our customer’s job just 1% easier.
I couldn’t have done this without the help of my collaborative high-agency team. A big thank you to the incredibly talented people for supporting me every step of the way.
Rohit Kashyap (UX Design & Research Intern)
Yashoheet Sethi (Product Manager)
Prateek Jha (Full-stack developer)
Sharad & the entire Data Science team.
+founders, engineers, operations team. And to our customer who took out time to sit with us and graciously offered us to shadow them :)